Not just a tiebreaker: what goal difference tells us

Newcastle’s goal difference of +5 with 65 points suggests they overachieved by about 10 points in 2011/12
It’s the second-to-last column on every league table, but goal difference is a statistic rarely discussed in football. In the short term it can be a vital tiebreaker, but in the long term it is one of the most accessible indicators of the long term sustainability of a team’s results.
The relationship between goal difference and points is transparent and intuitive – better teams win more points, score more goals and concede fewer. The chart below shows most teams are closely scattered around the best fit line, which tells us how many points we’d expect from a team given their goal difference.
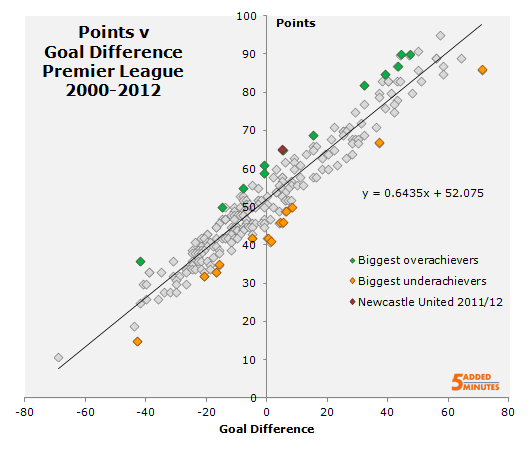
There are some major over- and underachievers – teams who deviated the most from this line of best fit. These are teams who, given their goal difference, you’d expect to finish in notably different positions. In absolute terms, Newcastle United’s 2011/12 campaign was the second-biggest overachieving season in the dataset. The Power of Goals’ Mark Taylor explains:
A large number of narrow victories can inflate at side’s final league record, but much of this success may be down to randomly fluctuating fortunes and there is no guarantee that these will be repeated in the future.
Simply eyeballing a side’s goal difference… Newcastle were the poster side for over achievement last season when they claimed 5th spot with goal difference of +5. The competitive balance within the current Premiership is relatively fixed from year to year and Newcastle’s goal difference would usually have only been good enough for seventh spot, if not lower. Eight wins by a one goal margin, coupled with three reasonably heavy defeats were the main factors behind their depressed goal difference and elevated finishing position.
In other words, Newcastle’s results were not sustainable in the long run. It’s akin to tossing several heads in a row, and expecting to continue flipping heads even though the underlying ‘ability’ of the coin to produce heads hasn’t changed.
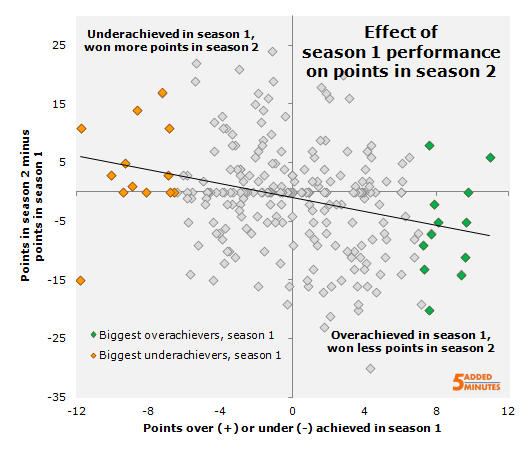
This is not just true for Newcastle, nor is it a criticism of Alan Pardew’s team. History suggests that the teams above that line of best fit will tend to do worse in terms of points the following season, and the teams below it (provided they avoid relegation) will tend to do better.
The over- and underachievement values are determined by the deviation from the line of best fit and the equation of this line. For example, Newcastle’s +5 goal difference is typical of a team with around 55 points; they ultimately overachieved by 10 points. They are not on the chart above as the current season is not over.
The biggest overachievers – the teams that won notably more points than we’d expect based on their goal difference – generally won fewer points the following season. The opposite is true for the biggest underachievers, who generally improved points-wise in the following season.
There is a lot of noise in the data – for instance spending may significantly change a team’s strength in between seasons – and James Grayson has already done some very good work looking at what particular stats are better at telling us about future performance (here and here)*.
However, we see goal difference on the league table every weekend, and it should be used more to help us understand how good a team really is; because even over 38 games the league table does lie.
A Championship consideration
We can apply this examination of goal difference to the Championship, and look at teams who might have been promoted ‘too early’. Do the teams that overachieve based on their goal difference then struggle in the top flight?
It depends. Of teams that won promotion, the biggest overachievers since the 1999-2000 season were Derby County in 2006-07, whose 84 points were earned with a goal difference of only +16. As we know, The Rams went on to record the lowest ever Premier League points total, which suggests they may have gone up too soon.
The second-lowest Premier League points total was recorded by Sunderland in 2006, another notable overachiever. Their Championship record (94 points, +35 goal difference) has parallels with Reading’s promotion as champions last season (89, +28).
On the other hand, two years after Derby’s promotion Birmingham went up with a similar record but finished 9th with 50 points. West Brom (2004), Stoke (2008) and Wolves (2009) also significantly overachieved but avoided the drop in the Premier League.
More seasons and better predictors of future performance would perhaps shed more light on whether teams can get promoted ‘too soon’.
*Incidentally, James also predicted Newcastle’s current plight before the start of the season, to an extent saving me from the irony of displaying the very cognitive bias I wrote about last month.
Trackbacks
- Who is the Most Consistent Striker in the EPL? « the counter attack
- DEFF: Relationship Between Goals Conceded and Points Dropped | the counter attack
- A Shooting Model – An Exp(G)lanation and Application | differentgame
- Matt gets MLS Table data, needs to figure out what to do with it. | The Gringo Samba
- Reason To Be Cheerful – The Emerson Inquiry


Hi,
Interesting article, how are the effects of season 1 on season distributed? Can you somehow use your work for prediction?
My name is Brewis Sissons, i’m a french undergraduate and recently started a blog about soccer statistics. It’s been only a few days but I already posted some articles. Feel free to read them and react. http://soccerhomemadestats.blogspot.fr/
I was wondering if it was possible that you add me to your blog roll, of course I’ll do the same.
Best regards,
B. Sissons