What the Premier League looks like
The Premier League’s final standings for the 2012-13 season is notable for the division between the top seven and the rest. West Bromwich Albion finished 13 points above relegated Wigan in 18th, ten places below them, but 12 points off Liverpool in 7th.
Thirteen teams conceded more goals than they scored; this hasn’t happened since 2001-02. James Grayson noted that this split didn’t just exist on a results level, but at a performance level too.
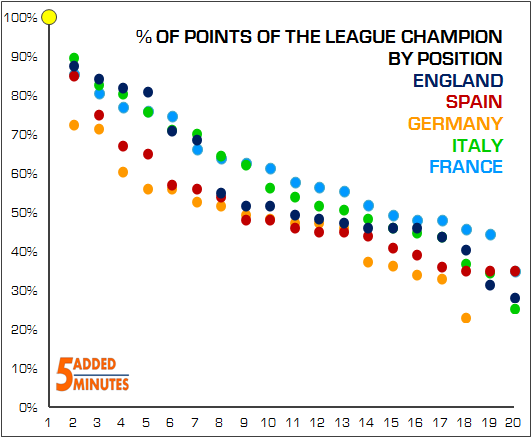
How does this compare with the rest of Europe? If we normalise the amount of points taken by the league champions, the number of points taken by the top seven teams in England is similar to Italy and France. Below this point, the Premier League resembles Spain’s La Liga, where roughly half the teams have roughly half the amount of points of the league champions, or less.
This relatively even distribution at the bottom of the league produced one of the tighter relegation contests in terms of the number of teams in danger of playing Championship football next season.
In all though, a disappointing season for title races across Europe’s top leagues, with not a single runner-up coming within 10% of the league winner’s points total.


Can you use this data to analyse how competitive the 5 championships are? If we can then interestingly French Ligue 1 seems to be the most competitive (points based).
Absolutely – historically it’s quite interesting to see how this has evolved in the Premier League, as the top teams have developed a bit of a monopoly on points.