England Batsmen: Averages
 Thanks in part to television graphics, a batsman’s average in cricket is one of the key benchmarks for evaluating his ability. It is, in effect, the number of runs he brings on average to his team every time he comes to the crease.
However, we rarely see how much a batsman brings once he’s already been at the crease for a certain period of time. When a batsman is ‘in’ – having scored 10, 20 or 30 runs – how many runs do we expect him to score?
With the start of another Ashes series imminent, I’ve looked at four of England’s key batsman – Alastair Cook, Kevin Pietersen, Jonathan Trott and Ian Bell – and examined how their averages change over the course of an innings.
For the purpose of this post, an ‘average’ is a player’s innings average. That is, his average in innings he was both dismissed and remained not out having faced more than 100 balls.
The chart below illustrates this average after each of the four batsman have scored a certain amount of runs in the innings. For example, once Kevin Pietersen (blue) has scored 20 runs in the innings, we can expect him to score 72 runs in total on average.

Take Bell and Trott; Trott has a higher average when he comes to the wicket, but once Bell has scored 10 runs, we can expect him to add more runs than his Warwickshire and England team mate. This is perhaps a reflection of Trott’s (recent) tendency to be dismissed after getting ‘in’. Only once Trott has reached 45 does he average higher than Bell again.
Similarly, once Alastair Cook has scored 25 runs, he tends to average higher than Kevin Pietersen, despite having a marginally lower average at the start of the innings. Having scored 45, Pietersen averages close to 100 runs per innings.
A metric we can derive from this is ‘runs above expected average’. For example, Pietersen’s innings average is 46.1. If he has scored 10 runs in the innings, a simplistic view would be that he will score another 46.1 runs, making his average at 10 runs 56.1. He actually averages 61.2 having scored 10 runs; thus his runs above expected average is 5.1 (61.2 – 10 – 46.1).
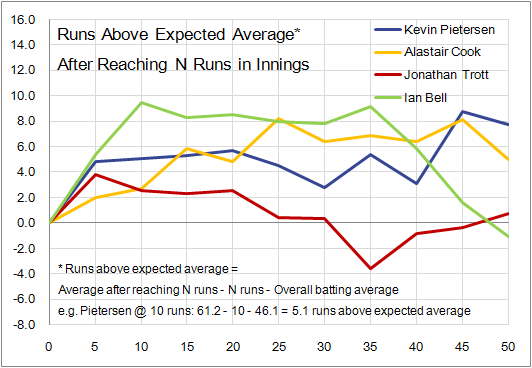
There are stark differences between Trott and Bell; the latter has shown a tendency to get out when already in, whilst Bell tends to cash in having added 10 runs.
Trott is by no means the worst in this respect – step forward Shane Watson.

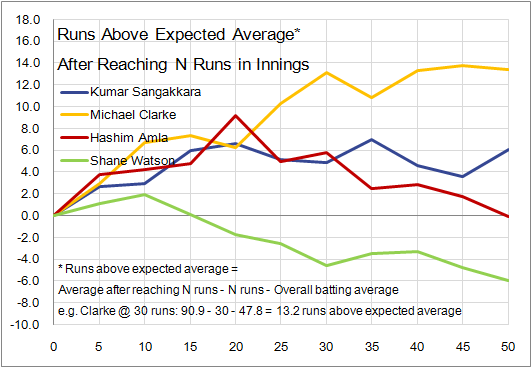
Having scored 30, Watson averages ‘only’ 60. This despite the fact he averages 35 when he comes to the crease. 60 – 30 – 35 = -5; Watson brings less runs than you’d expect having scored 30 runs. His captain Michael Clarke is the exact opposite, indeed his average is better than Sangakkara’s once both players have added 40 runs.
This metric is by no means perfect, and doesn’t reflect the evolution of players over their career. Nevertheless, it’d be interesting if broadcasters gave a suggestion as to how much more of Pietersen, Cook, Bell or Trott we might see once they’re in.


Nice post Omar, would be interesting to see how these numbers fluctuate playing in different continents under different conditions.